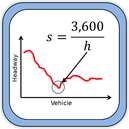
Saturation Flow

|
Tired of computing saturation flow and startup lost times using a stopwatch? This app turns your Android powered device into a stop watch with a custom interface that allows computing saturation flow rates and startup lost times at intersections.
Once you launch the app all you need to do is tap when each cycle starts (signal for movement turns green) and then tap the corresponding button once the vehicle goes through the point selected for measuring headways. After collecting the data the user can generate a quick summary which shows the saturation flow and startup lost time or can export the data to a CSV file which contains the raw data thus allowing further analysis. |
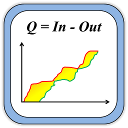
Stopped Delay
|
This app turns your android device into a stopped time delay computation tool. Once you launch the app you will be able to keep track of the queue length at a signalized intersection by tapping only four buttons on the screen. You simply tap a button once the light turns red and a corresponding button once a vehicle arrives, leaves the intersection, or goes by without stopping.
A summary of the results can be launched which will produce the average stopped delay experienced by vehicles and/or the average delay per cycle. A CSV file can also be generated which contains the timestamp for each vehicle arrival and departure. The CSV file also shows the number of vehicles in queue and cumulative arrival as a function of time. |
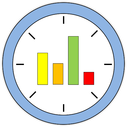
Travel Time and Delay
|
Do you need to conduct a quick travel time and delay study but don’t have an instrumented vehicle or simply you don’t want to go through the hassle of collecting data, downloading it to a computer, and then using a proprietary software to analyze the data? Why not use your cellphone or tablet? It already has a GPS and a touch screen which allows for an interface far more intuitive than dedicated hardware.
This app turns your Android device (phone or tablet) into a tool for collecting the data required for conducting travel time and delay studies which are commonly used by transportation engineers. Once you specify the details of the study, Latitude, Longitude, Speed, along with a corresponding timestamp are collected once per second. While collecting data, the app has two different interfaces: one for defining events using alphanumeric codes and another one for selecting among pre-defined events such as driving through an intersection, a stop sign, etc. |
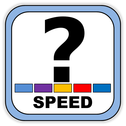
Average Speed
|
Do you need to know the average speed at which vehicles are traveling on a road? Don’t want to use old paper and stopwatch-based methodologies? No problem, this app will let you conduct average speed studies easily. If you know the distance between two checkpoints enter it into the app and then simply tap a button when a vehicle arrives to the first checkpoint and the same button once the vehicle arrives to a second checkpoint. The speed is automatically computed, displayed to you, and logged. You can easily indicate the type that each speed measurement corresponds by simply tapping the vehicle type on the screen.
As you log additional speeds the average speed is constantly updated to give you a sense of how your speed study is going. Once your study is completed you can generate a CSV report containing all the raw data (speeds, timestamps, and corresponding vehicle type) or simply take a look at a quick summary of the current study to know if you collected a statistically significant sample by looking at the number of speeds logged, the average, maximum, and minimum speeds, along with the standard deviation. |
Portable Studies by Afemas LLC
Sun Prairie, WI
Sun Prairie, WI
